
Expand your client offerings
Tactical Managers and Strategies
Theta Research simplifies your search for high quality managers with real-money, third-party-verified performance tracking for tactical investment managers and strategies. Discover ways to use strategy diversification to strengthen client portfolios. Implement tactical strategies to manage risk. Take greater advantage of opportunities for profit.
Read more
Data you can use -
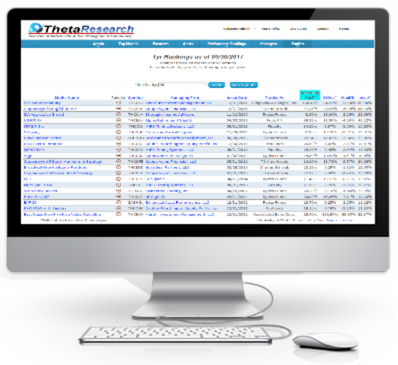
Theta makes performance analysis easier
View performance and risk statistics on all or selected models. See percentile rankings relative to the other models in the Theta database. View detailed charts and tables containing information on all daily and monthly statistics for your selected models. Performance on many models is updated daily.
Watch our webinar on
The Importance of Actual Returns
Rear view mirrors work best for backing up. When it comes to the success of an investment strategy, what counts is its performance in the current market environment. “Past performance is not necessarily indicative of future results” is overused, but true. “As imperfect as it is, actual performance beats whatever is in second place by a country mile.”
Watch the webinar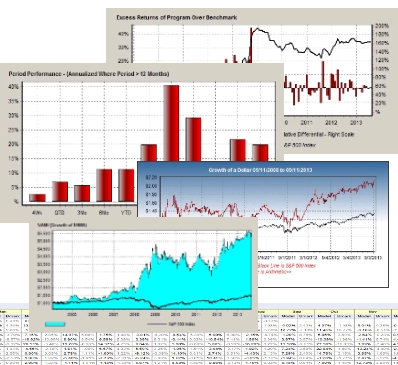
Exploit the Tactical Advantage
Your clients want more than the rollercoaster ride of buy-and-hold index investing. They are looking to you to manage their assets successfully, to limit the risk of investing, to find new investment opportunities and to help them build lasting wealth. While buy and hold may work for the very long term, it’s today that matters. Tactical investment management is a strategist’s approach to investing. It looks for opportunities created by current market conditions, strives to sidestep declines and avoid damaging losses and achieve long-term portfolio growth. Portfolio diversification, risk management and enhanced performance are standards of the best tactical strategies.
Theta - the Data You Need
Performance is the ultimate criteria. The right tactical managers and strategies for your clients are those that produce the intended results. At Theta Research, we gather, verify and publish only actual performance posted by professional investment managers. Every return is based on values received directly from a third-party custodian reflecting real-time trading in an actual account.
- No hypotheticals
- No backtesting
- No self-reporting
Generating a trading signal is only half of an investment manager’s story. There’s also the issue of executing those signals, especially in those strategies that have trading deadlines before the market close. Only through a review of actual performance can both signal generation and execution be verified. Real performance facilitates your due diligence. It reveals the smoke and mirrors and helps target managers and strategies that best fit your clients’ investment objectives. Subscription Plans
Join the Theta Community
Theta Research is committed to showcasing only the very best tactical management strategies from both established and emerging money managers, resulting in less “analysis paralysis.” Subscriptions are very reasonably priced. Online access assures you have access to the most current data, when you need it. The Theta online database provides:
- Model Ranking by Performance and Risk Metrics
- Industry Benchmark Comparative Statistics
- Detailed Charts and Tables
- Rolling Time Window Analysis
- Correlation and Composite Studies
- Updates on Theta-tracked Managers and Models
Theta News
Interviews
Watch our webinar for the Market Technicians Association with Shane Skwarek.
Listen to our podcast on Strategic Investor Radio with Charley Wright.
Top Performing Models
| Previous 2 Months as of 6/30/2024 | |
|---|---|
| Model Symbol | Performance |
| THCFCC | 34.09% |
| THCEJC | 29.23% |
| THCFDI | 23.23% |
| THBADI | 16.94% |
| THCEJB | 16.93% |